You step off a body composition scale or run a calculator and see a basal metabolic rate (BMR) of 1,250 kcal. The next thought is almost automatic: is that below average? Most search results answer with a single figure, such as "the average woman burns 1,400 kcal at rest", and anything lower suddenly feels like a broken metabolism.
Here is the short answer. For women in their 20s to 40s with an average build, a BMR of 1,200 to 1,300 kcal sits right in the normal range. BMR moves a lot with height, weight and age, so comparing yourself to one gender-wide number gives misleading results. Below you will find an average table built from national body-size data, followed by a practical method to decide whether your own number is genuinely low.
1. Average BMR table by age group and gender
The table uses average adult height and weight by sex and age group from the Korea National Health and Nutrition Examination Survey (KNHANES, rounded approximations), plugged into the Mifflin-St Jeor equation. Ages are the midpoint of each group (25, 35 and so on).
| Age group | Men: average build | Men: BMR | Women: average build | Women: BMR |
|---|---|---|---|---|
| 20s | 174 cm · 74 kg | ~1,708 kcal | 161 cm · 57 kg | ~1,290 kcal |
| 30s | 174 cm · 78 kg | ~1,698 kcal | 161 cm · 59 kg | ~1,260 kcal |
| 40s | 172 cm · 76 kg | ~1,615 kcal | 160 cm · 59 kg | ~1,204 kcal |
| 50s | 169 cm · 71 kg | ~1,496 kcal | 157 cm · 58 kg | ~1,125 kcal |
| 60s | 167 cm · 67 kg | ~1,394 kcal | 155 cm · 57 kg | ~1,053 kcal |
| 70s+ | 164 cm · 63 kg | ~1,285 kcal | 151 cm · 54 kg | ~948 kcal |
Three things stand out:
- Average BMR for women is about 1,250 to 1,300 kcal in the 20s and 30s, and around 1,200 kcal in the 40s. A reading of 1,200 or 1,300 is essentially average.
- Average BMR for men is about 1,700 kcal through the 20s and 30s. Within the same age group, men run roughly 400 to 450 kcal higher than women.
- The 20s and 30s barely differ, but from the 40s on, each decade drops about 100 to 120 kcal for men and 70 to 100 kcal for women. Part of that is age itself and part is the smaller average body size of older groups.
What changes with a larger average build
These are East Asian body-size averages. Populations with heavier average builds land higher. For example, a 45-year-old man at 175 cm and 90 kg comes out near 1,774 kcal, and a 45-year-old woman at 161 cm and 77 kg near 1,390 kcal. Heavier reference builds like these are one reason higher figures such as "1,400 kcal for women" circulate online. The lesson is the same either way: the average only means something next to the body size behind it.
2. How the table was built: average body size × Mifflin-St Jeor
Hardly any country measures BMR directly across its whole population, because indirect calorimetry (analyzing the air you breathe at rest) is slow and needs lab equipment. So the table answers a slightly different question: what BMR would we expect for a person of average build? The equations are:
- Men: 10 × weight (kg) + 6.25 × height (cm) − 5 × age + 5
- Women: 10 × weight (kg) + 6.25 × height (cm) − 5 × age − 161
Mifflin-St Jeor is generally considered closer to measured values in modern adults than the older Harris-Benedict equation, which is why dietitians use it widely. For the average woman in her 30s (161 cm, 59 kg, age 35): 590 + 1,006.25 − 175 − 161 = 1,260.25, or about 1,260 kcal.
The equation also shows what drives BMR. Each extra kilogram adds 10 kcal, each extra centimeter adds 6.25 kcal, and each year of age subtracts 5 kcal. Two women in their 30s at 150 cm and 168 cm differ by more than 110 kcal from height alone, which is exactly why one average cannot judge everyone.
3. Women at 1,100 to 1,500 kcal: where does your number fall?
People often search for specific numbers like "BMR 1,200 female" or "BMR 1,400 female". Working backwards, here is the body weight that produces each value for a 30-year-old woman who is 160 cm tall (the equation simplifies to 10 × weight + 689).
| BMR | Weight for a 30-year-old, 160 cm woman | vs. average for women in their 30s (~1,260) | What it suggests |
|---|---|---|---|
| 1,100 kcal | ~41 kg | ~160 kcal lower | Very lean build. Check for underweight (BMI around 16) |
| 1,200 kcal | ~51 kg | ~60 kcal lower | Slightly lighter than average. Normal |
| 1,300 kcal | ~61 kg | ~40 kcal higher | Average to slightly larger build |
| 1,400 kcal | ~71 kg | ~140 kcal higher | Heavier, or notably muscular |
| 1,500 kcal | ~81 kg | ~240 kcal higher | Much heavier, or tall |
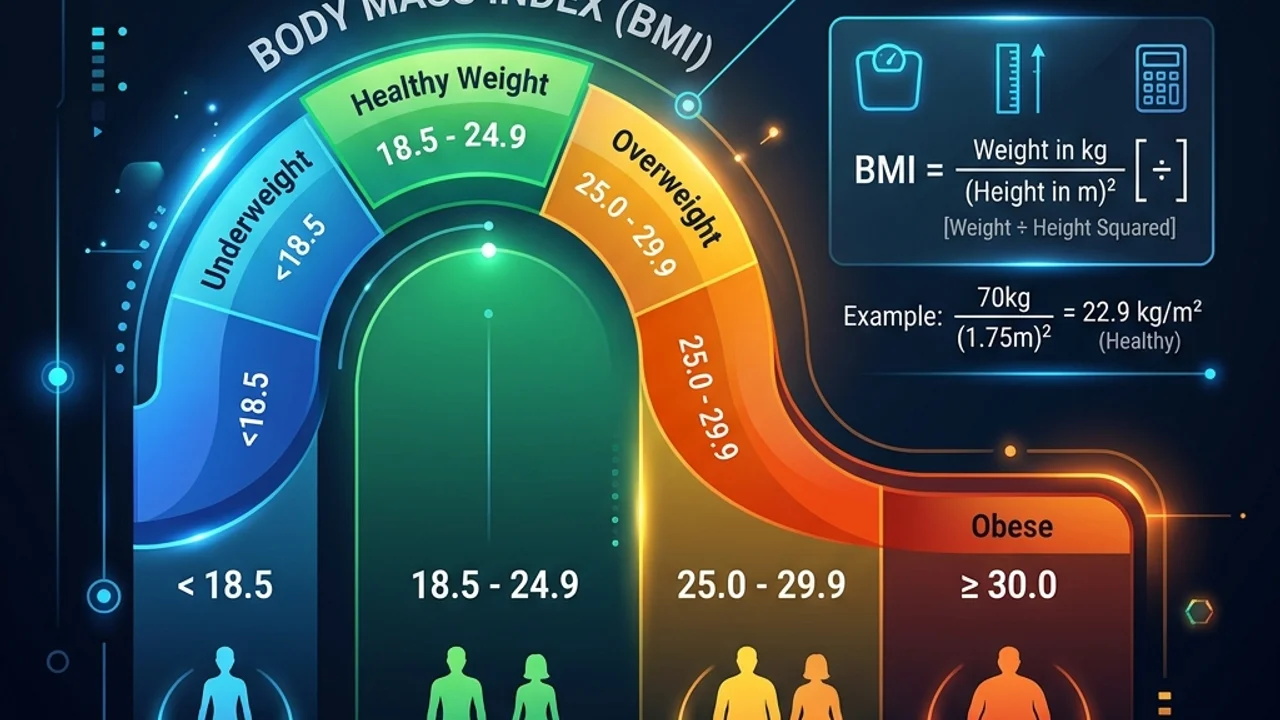
A higher BMR is not automatically better. If 1,500 kcal comes from extra body weight, it is a caution sign rather than a health win. And a 152 cm, 48 kg woman reading in the 1,100s is right where her body size predicts. Ask whether the number fits your build, not whether it is high or low. To check whether your weight itself is in a healthy range, see the BMI formula and adult weight standards guide.
4. Three reasons a BMR comes out below average
A smaller frame
This is the most common reason. BMR is the energy needed to keep your body running, so a smaller body needs less. Among 45-year-old women alone, the spread looks like this:
| 45-year-old woman | Height and weight | BMR (Mifflin) | vs. 40s average (~1,204) |
|---|---|---|---|
| Small frame | 150 cm · 48 kg | ~1,032 kcal | ~170 kcal lower |
| Average frame | 160 cm · 59 kg | ~1,204 kcal | Same |
| Larger frame | 165 cm · 65 kg | ~1,295 kcal | ~90 kcal higher |
The 1,032 kcal on the small frame looks "below average" but signals nothing wrong with metabolism. It simply matches the body.
Lower muscle mass
Muscle burns more energy at rest than fat. Two people with the same height and weight can have different real BMRs if one carries more muscle. Body composition analyzers such as InBody estimate BMR from fat-free mass (muscle, bone, water) rather than from total weight, so this gap shows up directly on the printout. If your weight is average but the analyzer's BMR is low, suspect low muscle mass first.
Getting older
The equation removes 5 kcal per year, or 50 kcal per decade. Add the gradual muscle loss that typically starts after 40 and BMR falls even if weight stays the same. A woman in her 50s at 1,100 kcal looks low against a 20-something benchmark, yet she is almost exactly on the average for her own age group (about 1,125 kcal).
5. How to decide if your BMR is truly low
Use the average table to see roughly where you stand. To actually judge "below average", follow these steps:
- Calculate your own Mifflin prediction from your height, weight and age. That is the BMR your build should produce.
- If you have a measured value (for example from a body composition scale), compare it with the prediction. If not, compare the prediction with the age-group table just to see where your build sits.
- If the measured value is more than 10% below the prediction, low muscle mass is the likely cause. Prediction equations commonly differ from individual measurements by around 10%, so anything within that band counts as normal.
- If the prediction itself is below the average, the cause is body size. If your weight is in a healthy range, there is nothing to fix.
Example: a 35-year-old woman at 162 cm and 60 kg has a prediction of 600 + 1,012.5 − 175 − 161 = about 1,277 kcal. A measured 1,250 kcal is about 2% lower, which is normal. A measured 1,120 kcal is about 12% lower, a cue to prioritize strength training and protein.
One caveat: if you are losing weight without trying, feel unusually cold, or stay tired for weeks, a condition that lowers metabolism (such as an underactive thyroid) may be involved. In that case a doctor's check comes before any number comparison.
6. What to adjust if your BMR is on the low side
- Do not eat below your BMR. It is the energy you burn lying still, and diets below it tend to strip muscle, which pushes BMR down further.
- Set your actual intake from total daily energy expenditure (TDEE), which is BMR multiplied by an activity factor. Someone who exercises lightly one to three times a week uses 1.375. A woman with a 1,250 kcal BMR maintains at about 1,720 kcal, and a deficit of 300 to 500 kcal from there is a reasonable pace for weight loss.
- Add strength training two or three times a week. More muscle raises BMR at the same body weight and moves your measured value closer to the prediction.
- Spread protein across meals so the training actually turns into muscle.
7. Frequently asked questions (FAQ)
Q1. Is a BMR of 1,200 kcal low for a woman?
For women in their 20s to 40s, it is essentially the average (about 1,200 to 1,290 kcal), so it is not low. If you are 160 cm or shorter, or weigh around 50 kg, it fits your build. If you are 165 cm or taller and reading 1,200 kcal, it is worth checking your muscle mass.
Q2. Why does my body composition scale show a different BMR from the calculator?
They use different inputs. A calculator estimates from height, weight and age, while a body composition analyzer estimates from measured fat-free mass. Muscular people tend to get a higher analyzer reading and people with more body fat a lower one. A gap within about 10% is normal.
Q3. What is the average BMR for men?
Using average adult male builds in the table, it is about 1,700 kcal in the 20s and 30s, about 1,620 kcal in the 40s and about 1,500 kcal in the 50s. Larger men commonly come out between 1,800 and 2,000 kcal.
Q4. What is the most reliable way to raise BMR?
Build muscle. Gaining weight also raises BMR on paper, but that is not a healthy route. A few months of strength training two to three times a week with enough protein usually shows up as higher fat-free mass and a higher BMR on a body composition scan.
8. Compare your own BMR with the average table
To use the table properly you need your own prediction first. Enter sex, height, weight and age in the BMR calculator and it returns your BMR with the same Mifflin-St Jeor equation used in this article. Line that number up with your age group in section 1 to see where your build sits, and put it next to a measured value to apply the 10% rule for spotting low muscle mass. Pick an activity level and it also shows your TDEE, which gives you a floor for daily intake.
To confirm whether a low BMR simply reflects a small frame, check your weight range with the BMI calculator. The cutoffs are explained in the BMI formula and adult weight standards guide.